

How to Read Median Property Price Data in Australia Without Being Misled
General Advice Warning: Property market statistical indices published by commercial portals and government agencies measure aggregate historical transactions. They do not predict future asset performance. Always verify individual property micro-attributes before investing.
Quick Answer
A median property price is the exact middle point of all settled transactions in a specific area over a given timeframe (where 50% sold for more and 50% sold for less). While superior to an average (mean) because it resists extreme prestige sales, median prices suffer from severe ‘compositional bias.’ If high-end homes sell disproportionately in a quiet quarter, the median price surges even if underlying property values are stagnant or declining.
Every month, Australian financial media headlines proclaim dramatic shifts in property values based almost exclusively on a single statistic: the median house price. Headlines declare that a suburb has surged by 15% or fallen by 8% in a single quarter, prompting anxious investors to chase “hotspots” or retreat from cooling markets.
However, professional property analysts view raw median price figures with deep skepticism in our Australian property market data research. A median price measures transaction composition—the specific basket of properties that happened to change hands—rather than the true underlying capital appreciation of an individual home.
Median vs Mean (Average): The Basic Math
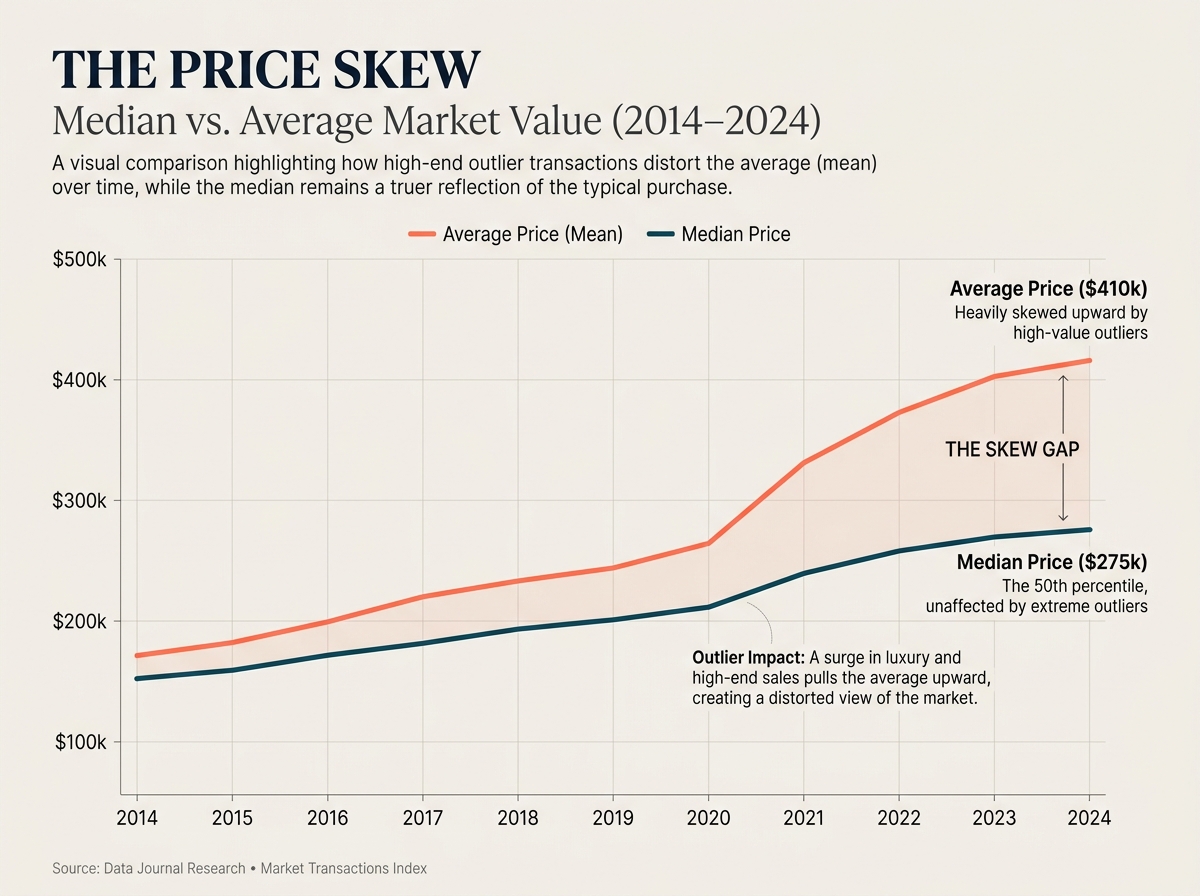
To understand why analysts prefer medians over arithmetic averages (means), consider a simple sample of 5 house sales in an Australian suburb during a single weekend:
- Sale 1: $750,000 (Small 2-bed cottage)
- Sale 2: $800,000 (Unrenovated 3-bed home)
- Sale 3: $850,000 (The Median: Exactly in the middle)
- Sale 4: $920,000 (Renovated 3-bed home)
- Sale 5: $3,200,000 (Acreage estate with tennis court)
In this sample, the Median is $850,000. However, the arithmetic Average (Mean) is $1,304,000. Because a single luxury transaction artificially inflates the average by nearly half a million dollars, the median provides a far more accurate representation of typical local dwelling prices.
The Fatal Flaw: Compositional Bias Explained
While the median resists isolated outliers, it is highly vulnerable to compositional bias. Compositional bias occurs when the mixture of properties transacting changes between measurement periods.
Example: How a Market ‘Falls’ While Prices Actually Rise
Imagine a coastal suburb containing 500 entry-level apartments (fair value: $600,000) and 500 beachfront houses (fair value: $1,500,000):
| Quarter | Sales Composition | Fair Market Value Trend | Reported Median Price |
|---|---|---|---|
| Quarter 1 | 10 Beachfront Houses ($1.5M) + 2 Apartments ($600k) | Baseline valuation | $1,500,000 |
| Quarter 2 | 2 Beachfront Houses ($1.6M ↑) + 10 Apartments ($650k ↑) | Both asset classes rose in value (+6%–8%) | $650,000 (↓ 56% Crash!) |
In Quarter 2, every single property in the suburb increased in value. Yet, because interest rate hikes discouraged beachfront luxury vendors from listing and prompted a flood of entry-level apartment sales, the reported suburb median price collapsed by 56%. An uneducated investor reading newspaper headlines would conclude the suburb suffered a property market crash, when in reality capital values were expanding.
When analyzing prospective markets, investors must evaluate rental returns alongside price indices. Explore our breakdown of gross vs net rental yield to verify operational cash flow integrity.
Sample Size Traps in Low-Volume Suburbs
Statistical reliability depends fundamentally on sample size. In an Australian capital city with 25,000 monthly transactions, median price trends are relatively stable. However, at a micro-suburb level, transaction volumes are tiny:
- Many boutique Australian suburbs record only 15 to 35 house sales per year (fewer than 3 sales per month).
- If three unrenovated deceased estate homes sell in April, the suburb median plunges. If three brand-new architectural homes sell in May, the median soars.
- Rule of Thumb: Never rely on quarterly median price percentage changes in any suburb with fewer than 50 recorded settled sales in the measurement window.
To avoid local statistical anomalies, cross-reference median trends against broad capital city benchmarks. See our comparative analysis of rental yields by capital city.
How Professional Analysts Measure True Price Growth
To overcome compositional bias, institutional researchers and sophisticated investors employ superior price measurement methodologies:
1. Hedonic Imputation (CoreLogic / Cotality)
The **Hedonic Home Value Index** models property values based on underlying physical attributes: land size, bedroom count, bathroom count, geographic coordinates, and building age. By adjusting for changes in the quality and composition of homes sold, the hedonic model tracks how much a standardized constant-quality dwelling has changed in value.
2. Repeat Sales Indices
Popularized globally by the Case-Shiller index and utilized by certain Australian data houses, repeat-sales indices only track properties that have sold at least twice over time. By measuring the price differential between consecutive sales of the exact same asset, compositional distortion is minimized.
3. Stratified Median Measures (ABS)
The Australian Bureau of Statistics (ABS) groups properties into socio-economic and price strata before calculating changes, preventing low-tier transaction spikes from distorting national totals.
Macroeconomic shifts driven by central bank policy directly impact dwelling demand. Review our guide on how the RBA cash rate affects investors to understand the monetary policy transmission mechanism.
Practical Rules for Reading Property Data
When reviewing property market data, apply these analytical filters:
- Look at 12-Month Rolling Medians: Rolling annual figures smooth out quarterly seasonal spikes and transaction composition volatility.
- Check Days on Market (DOM) & Vendor Discounting: If median prices are supposedly rising but DOM has lengthened from 22 days to 58 days and vendor discounting has widened, the price growth is an illusion caused by low sales volumes.
- Verify Stock on Market (SOM): Analyze whether total active listings are shrinking (creating genuine scarcity) or accumulating.
Frequently Asked Questions: Interpreting Median Price Data
Why do CoreLogic, Domain, and PropTrack report different median prices?
Each major property data provider employs different statistical methodology and reporting cut-offs. Domain and PropTrack often report rolling 12-month or quarterly stratified medians based on agent-reported sales, whereas CoreLogic emphasizes its hedonic regression index that incorporates government valuer-general settled sales. These differing calculation models routinely produce divergent monthly growth rates.
Are apartment median prices less volatile than house medians?
Apartment medians can actually be more volatile in high-density areas. When a 200-unit off-the-plan apartment tower settles all its contracts in a single month, a massive cluster of identical sales hits the public register simultaneously, skewing the suburb unit median and creating artificial statistical jumps that normalize within three months.
Primary Sources & Authority References
- Australian Bureau of Statistics (ABS) – Total Value of Dwellings & Residential Property Price Methodology.
- CoreLogic (Cotality) – Hedonic Home Value Index Methodology Whitepaper.
- Reserve Bank of Australia (RBA) – Research Discussion Paper: Measuring Australian House Prices.