Gross vs Net Rental Yield in Australia: The Hidden Costs That Erode Cash Flow
General Advice Warning: Rental yield calculations represent educational financial formulas. Operational holding expenses vary significantly across property types, local councils, and building ages. Consult an accountant or financial planner for customized cash flow modelling.
Quick Answer
Gross rental yield is a simple marketing calculation: annual rental income divided by purchase price (expressed as a percentage). Net rental yield subtracts all real-world holding expenses (council rates, water levies, body corporate fees, landlord insurance, property management, maintenance, and vacancy periods) before dividing by total acquisition cost. In Australia, a headline 5.5% gross yield frequently shrinks to an actual net yield of 3.2%–3.8% once ongoing operating costs are deducted.
When marketing residential real estate to investors, selling agents and property spruikers frequently boast about high rental yields: *”High-yielding regional cash cow returning 6.5%!”* To novice investors, high yields look like an effortless guarantee of passive income and immediate positive cash flow.
However, relying solely on **gross rental yield** is one of the most widespread accounting errors in property investing. Gross yield measures top-line revenue while completely ignoring the substantial operating outflows required to maintain Australian residential property in our market data framework. Understanding how to calculate true **net rental yield** is essential to avoid investing in cash-draining assets.
The Mathematical Formulas: Gross vs Net Yield
The distinction between the two metrics lies in how expenses and acquisition costs are accounted for:
1. The Gross Rental Yield Formula
Gross Yield (%) = (Weekly Rent × 52 / Purchase Price) × 100
For example, a property purchased for $750,000 renting for $650 per week:
($650 × 52 = $33,800) / $750,000 × 100 = 4.51% Gross Rental Yield.
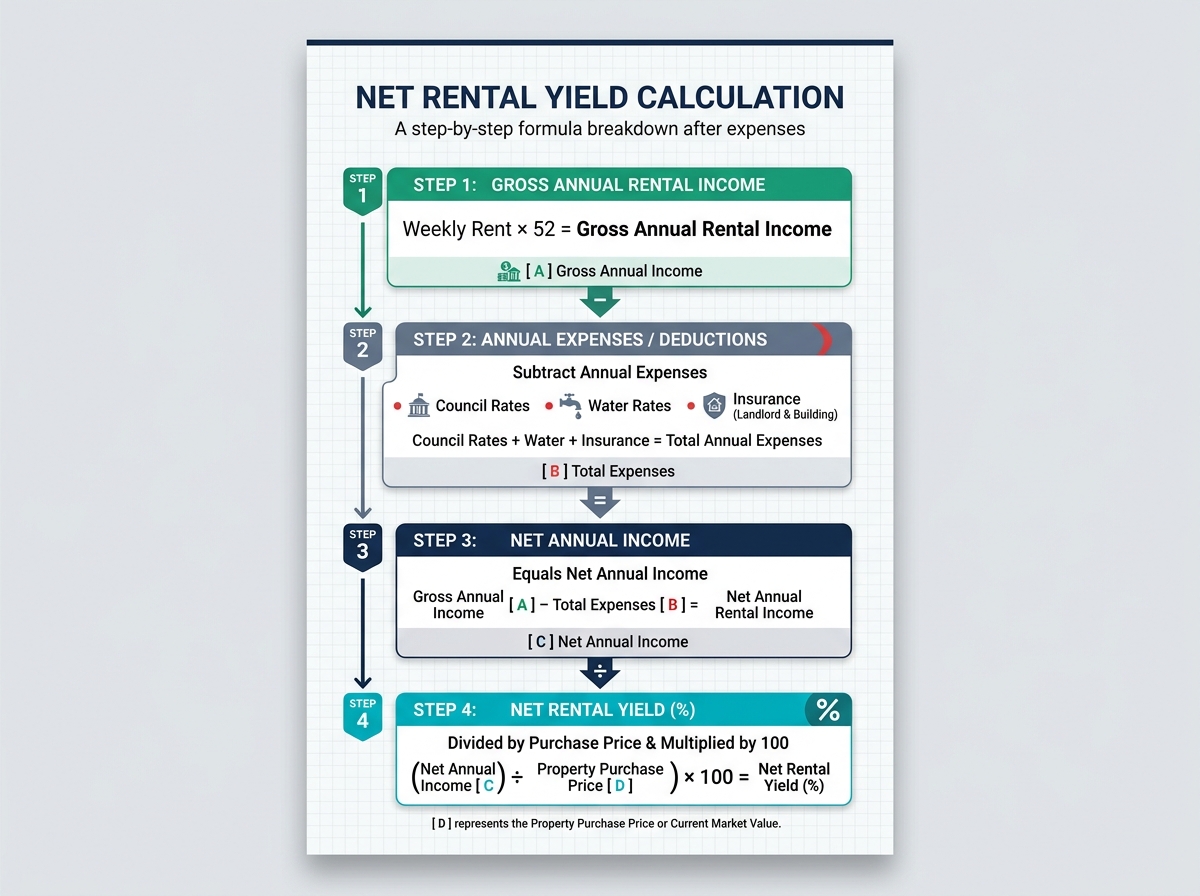
2. The True Net Rental Yield Formula
Net Yield (%) = [(Annual Rental Income − Total Annual Operating Expenses) / Total Acquisition Capital] × 100
Net yield accounts for reality on both sides of the equation: it subtracts all holding costs from revenue, and adds upfront stamp duty and conveyancing fees to the denominator.
Itemising the Hidden Costs: The 8 Cash Flow Eroders
To calculate net yield accurately, investors must itemise all ongoing non-mortgage holding expenses:
| Operating Expense | Typical Annual Cost (Detached House) | Typical Annual Cost (Strata Unit) |
|---|---|---|
| Council Rates | $1,800 – $2,800 / year | $1,200 – $1,800 / year |
| Water Rates & Usage | $1,000 – $1,500 / year | $800 – $1,200 / year |
| Body Corporate / Strata Levies | $0 | $3,500 – $8,500+ / year |
| Property Management Fees | 6.0% – 8.8% of gross rent (~$2,400) | 6.0% – 8.8% of gross rent (~$2,200) |
| Landlord & Building Insurance | $1,800 – $2,600 / year | $450 – $750 / year (contents/landlord only) |
| Maintenance & Repairs Reserve | 1.0% of property value (~$7,500) | 0.5% of property value (~$3,500) |
| Vacancy Allowance (2 weeks) | ~$1,300 | ~$1,200 |
When assessing tenant turnover risks, review national vacancy benchmarks in our analysis of rental vacancy rates explained.
Worked Case Study: The 5.5% Regional Illusion
Consider a practical comparison illustrating why gross yield can be profoundly misleading:
Property A: Regional Townhouse (Advertised Gross Yield: 5.63%)
- Purchase Price: $500,000 | Rent: $541/week ($28,150/year)
- Upfront Stamp Duty and Purchase Costs: $25,000 (Total Capital: $525,000)
- Annual Operating Costs:
- High Strata Levies (older building with pool): $5,200
- Council Rates: $2,200 | Water: $1,200
- Management Fees (8.8% regional rate): $2,477
- Insurance: $600 | Maintenance Reserve: $2,500 | 2 Weeks Vacancy: $1,082
- Total Expenses: $15,259
- Net Annual Operating Income: $28,150 − $15,259 = $12,891
- Real Net Yield: ($12,891 / $525,000) × 100 = 2.45% Net Yield!
Despite being advertised with an enticing 5.63% gross yield, over 54% of total rental revenue is consumed by operational costs, producing an actual net return of just 2.45%—far below inflation and current cash savings rates.
When expenses exceed rental income, negative gearing provisions come into play. Learn how tax deductions offset cash flow deficits in our guide on negative gearing explained.
The Yield vs Capital Growth Trade-Off
In the Australian property market, an inverse relationship historically exists between rental yields and long-term capital appreciation:
- High-Yielding Markets (Regional/Mining Towns): Often feature gross yields of 6.5% to 8.0%. However, their capital growth is frequently volatile or stagnant due to concentrated single-industry employment drivers and abundant land supply.
- High-Growth Metropolitan Markets (Sydney/Melbourne Inner-Ring): Typically offer modest gross yields of 2.8% to 3.8%. However, severe land scarcity, strong population growth, and high household incomes drive consistent long-term capital compounding that dwarfs annual rental yields.
Review current metropolitan benchmarks across all major Australian cities in our report on rental yields by capital city.
Step-by-Step Worksheet: Conducting a Pre-Purchase Net Yield Audit
Before submitting a formal binding purchase contract, smart property investors conduct a structured net yield pre-purchase audit:
- Request Actual Outgoing Invoices: Demand copies of the latest Section 32 vendor statement or contract of sale, noting exact quarterly council rate and water service invoices rather than relying on real estate agent estimates.
- Review Strata Sinking Fund Records: For strata townhouses or units, inspect the past three years of AGM minutes. Check the administrative fund balance, the capital works sinking fund reserves, and verify if special building levies are pending for roof replacements, lift maintenance, or structural repairs.
- Obtain Written Rental Appraisals: Contact two independent local property management agencies (not affiliated with the selling agency) to obtain conservative written rental appraisals based on currently signed leases within a 500-meter radius.
- Model Interest Rate Sensitivity: Stress-test your cash flow against interest rate increases of 1.00% to 2.00% to ensure the property does not produce an unsustainable negative cash drag.
Frequently Asked Questions: Rental Yield Analysis
Does net rental yield include mortgage interest repayments?
In standard financial accounting, net rental yield measures the *unleveraged operational return* of the physical real estate asset itself, excluding mortgage interest. Factoring in loan interest, repayment terms (P&I vs IO), and tax offsets transitions the calculation into Cash-on-Cash Return or Net Cash Flow. Keeping net yield separate from mortgage terms allows investors to compare properties objectively regardless of how much debt they choose to borrow.
How does depreciation impact net rental yield?
Tax depreciation (Division 40 plant & equipment and Division 43 capital works) is a *non-cash deduction*. It does not affect your immediate cash net yield, but it significantly boosts your after-tax net yield by generating substantial tax refund offsets against ordinary salary income at tax time.
Primary Sources & Authority References
- ATO – Rental Properties: Claiming Deductions and Rental Income.
- SQM Research – National Gross and Net Rental Yield Indices.
- CoreLogic – Rental Market Performance & Yield Calculations Report.