Rental Yields by Australian Capital City: Sydney, Melbourne, Brisbane, Perth & Adelaide
General Advice Warning: Capital city rental yields represent broad statistical metropolitan averages. Rental yields vary widely between individual suburbs, dwelling conditions, and property types. Seek professional financial advice before executing interstate property acquisitions.
Quick Answer
Across Australian capital cities, gross rental yields diverge significantly between markets. Sydney and Melbourne record the lowest gross yields (typically 2.8% to 3.4% for detached houses), reflecting elevated land values and premium capital appreciation profiles. Conversely, Perth, Adelaide, and Darwin deliver higher gross rental yields (4.2% to 6.5%), driven by lower acquisition prices, tight rental vacancy rates, and commodity-linked demographic demand.
Australia does not possess a single homogenous property market. Instead, the national real estate landscape is divided across eight distinct capital city jurisdictions, each characterized by unique demographic drivers, housing supply constraints, state economic conditions, and rental yields.
For property investors seeking to construct a balanced portfolio, understanding how rental yields compare across major metropolitan centers is essential. Comparing capital city performance allows investors to strategically balance cash-flow stability against long-term capital compounding in our market data research suite.
Capital City Gross Yield Benchmarks: Houses vs Units
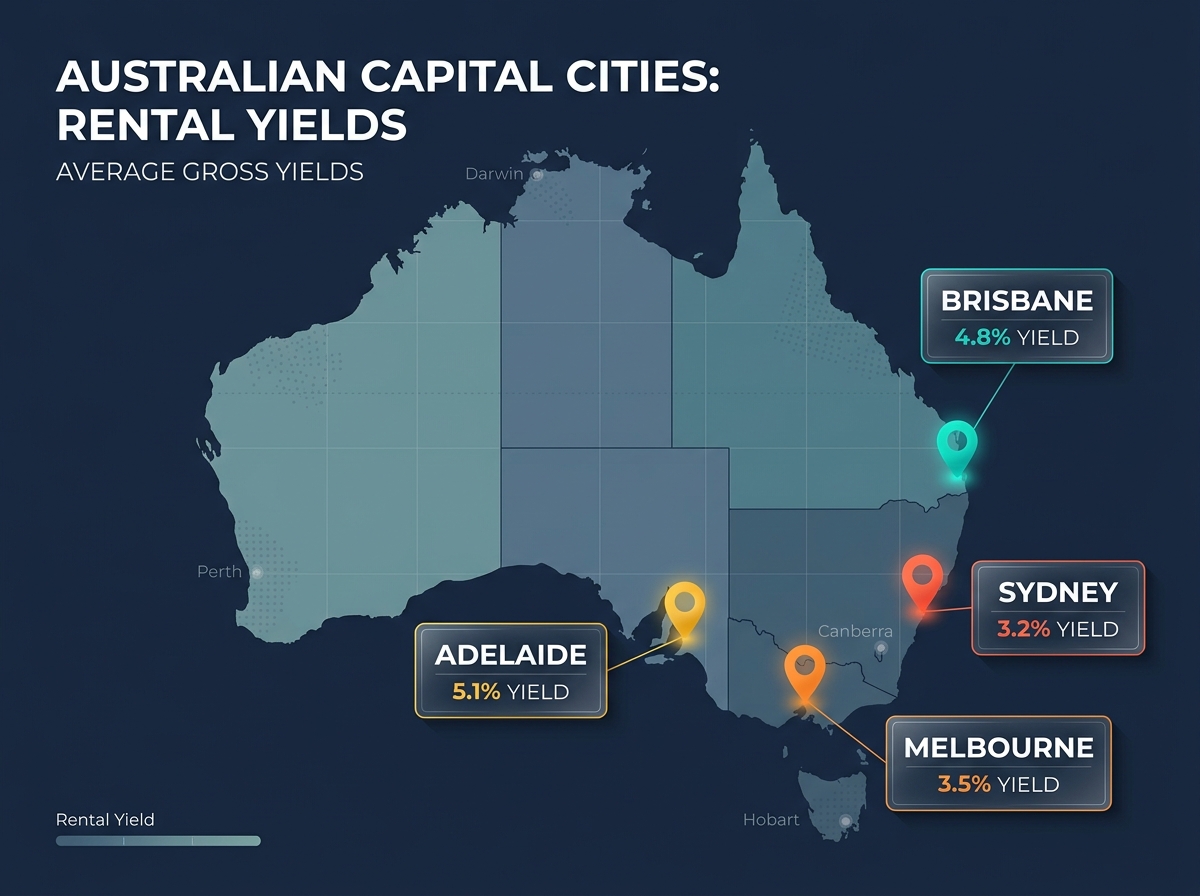
To evaluate the national landscape, examine prevailing benchmark gross rental yields across Australia’s major capital cities:
| Capital City | Median House Price | House Gross Yield | Unit Gross Yield | Typical Vacancy Rate |
|---|---|---|---|---|
| Sydney | $1,450,000 | 2.9% | 4.1% | 1.4% |
| Melbourne | $940,000 | 3.3% | 4.6% | 1.6% |
| Brisbane | $920,000 | 3.7% | 5.1% | 1.1% |
| Adelaide | $800,000 | 3.9% | 5.0% | 0.7% |
| Perth | $770,000 | 4.4% | 6.2% | 0.8% |
| Darwin | $510,000 | 6.2% | 7.1% | 2.1% |
Deep Dive: Analyzing Market Dynamics by City
1. Sydney (The Capital Growth Heavyweight)
Sydney maintains the highest dwelling prices in Australia, which naturally suppresses gross rental yields. A detached family home in middle-ring Sydney renting for $1,000 per week against an asset value of $1,600,000 yields just 3.2% gross. However, Sydney’s geographical constraints (bounded by the Pacific Ocean and the Blue Mountains), corporate headquarter concentration, and high household income density historically produce superior long-term capital compounding.
2. Melbourne (The Value Rebalancing Market)
Following extended economic adjustments and significant state land tax reforms, Melbourne property values have experienced relative underperformance compared to other capitals. Consequently, Melbourne house yields have expanded into the 3.3% to 3.6% range, offering attractive relative entry pricing for long-term growth investors.
3. Brisbane and South East Queensland (The Population Magnet)
Brisbane has enjoyed unprecedented interstate migration inflows from southern states, driving exceptional rental market tightness. With vacancy rates hovering around 1.0%, rental inflation has remained strong, maintaining attractive yields of 3.7% to 4.2% across middle-ring houses and over 5.0% on townhouses.
4. Perth (The Resource-Driven Cash Flow Star)
Perth has emerged as the standout performer for cash-flow-focused investors. Supported by mining sector strength, international skilled migration, and relative housing affordability, Perth yields frequently exceed 4.5% for detached dwellings and 6.0%+ for residential units. However, investors must remember that Western Australian property cycles have historically experienced sharper boom-and-bust trajectories aligned with commodity cycles.
When investing outside your home state, factor in jurisdictional duties. Review our comparative guide on stamp duty for investors by state.
The Impact of Operational Expenses Across Jurisdictions
Gross yield tells only half the story. Real returns depend on state-specific holding costs:
- State Land Tax Thresholds: Purchasing multiple properties in Victoria triggers land tax at a much lower threshold ($50,000) than New South Wales or Queensland, drastically eroding net cash flow. Read our state breakdown on land tax for investors by state.
- Municipal Council Rates: Regional and interstate councils frequently levy significantly higher annual council and water service charges than metropolitan Sydney councils, reducing net returns.
Always calculate true net operational income before committing capital. Use our mathematical framework in gross vs net rental yield explained.
Adelaide and Regional Markets: Structural Value Comparison
Adelaide (The Resilient Mid-Tier Contender)
Adelaide has transformed from a sleepy secondary market into one of Australia’s most consistent performers. Backed by expanding defence, medical manufacturing, and technology sectors, median house prices have surged while rental vacancy rates have hovered near national record lows (frequently below 0.8%). With house gross yields averaging 3.8% to 4.2%, Adelaide offers investors an attractive blend of steady cash flow and defensive affordability.
Regional City Yields vs Capital Metropolitan Risks
Regional hubs such as Geelong, Newcastle, the Sunshine Coast, and Ballarat attracted record capital inflows during the work-from-home era. However, regional markets require careful demographic screening:
- Diversified Regional Centers: Regional cities supported by major regional hospitals, universities, and diverse agricultural/manufacturing bases offer sustainable 4.5% to 5.5% gross yields with resilient tenant demand.
- Single-Industry Mining Corridors: Towns dependent entirely on iron ore, coal, or gas exploration (e.g. Karratha, Port Hedland, Moranbah) routinely exhibit eye-watering gross yields of 8.0% to 12.0%. However, these markets carry catastrophic capital loss risks when commodity cycles downturn and major mining projects transition from construction to automated production.
Constructing a Balanced Multi-State Property Portfolio
Institutional property advisors recommend that mature property investors diversify their portfolio across multiple capital cities:
- State Land Tax Ring-Fencing: Because each Australian state administers its own separate land tax threshold, holding three $800,000 properties across NSW, Queensland, and Western Australia allows you to utilize three separate statutory tax-free thresholds, saving tens of thousands of dollars in annual land tax compared to holding all three in a single state.
- Economic Cycle Smoothing: Different capital cities operate on staggered economic timelines. When Sydney and Melbourne are consolidating during interest rate tightening, commodity-backed Perth or infrastructure-rich Brisbane can continue outperforming.
Frequently Asked Questions: Capital City Yields
Should investors chase the highest yielding city?
Not blindly. Chasing maximum rental yield often funnels capital into regional mining communities or secondary unit developments that lack economic diversity. A sound investment strategy balances sufficient rental cash flow (to maintain borrowing serviceability) with strong land-to-asset ratios in metropolitan locations that generate capital growth.
Are apartment yields in capital cities safe?
While urban units offer higher headline gross yields (often 5% to 6%), high body corporate strata levies, special building defect levies, and extensive new supply pipelines frequently reduce their net returns and capital growth rates compared to detached dwellings.
Primary Sources & Authority References
- CoreLogic – National Capital City Rental Market Performance Report.
- SQM Research – Capital City Gross Rental Yield Benchmarks.
- ABS – Residential Property Price Indexes: Eight Capital Cities.